 |
|
Integrative spatiotemporal modeling in IMP
|
Here, we describe the first modeling problem in our composite workflow, how to build models of heterogeneity using IMP. In this tutorial, heterogeneity modeling only includes protein copy number; however, in general, other types of information, such as the coarse location in the final state, could also be included in heterogeneity models.
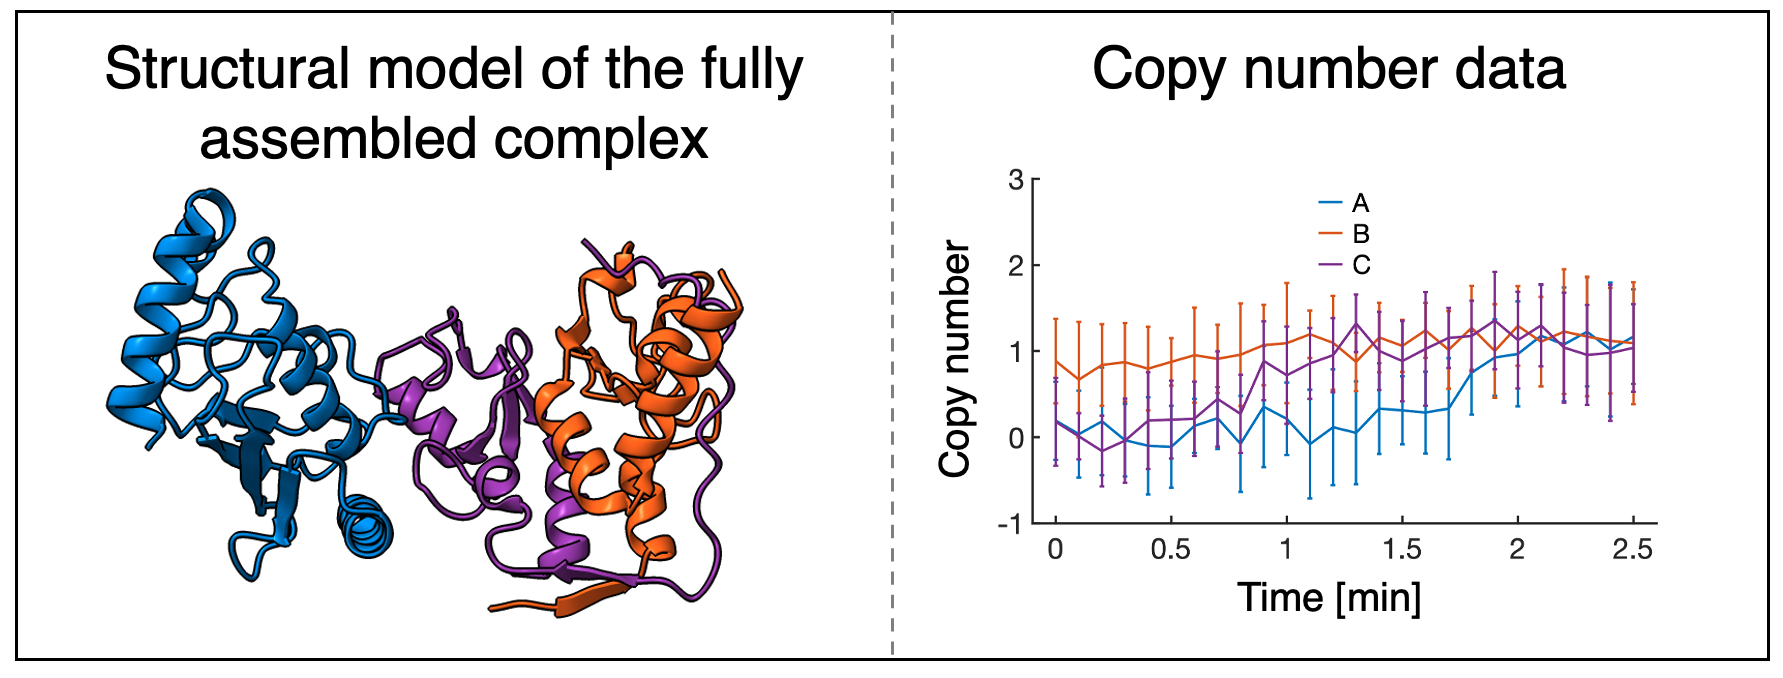
We begin heterogeneity modeling with the first step of integrative modeling, gathering information. Heterogeneity modeling will rely on copy number information about the complex. In this case, we utilize the X-ray crystal structure of the fully assembled Bmi1/Ring1b-UbcH5c complex from the protein data bank (PDB), and synthetically generated protein copy numbers during the assembly process, which could be generated from experiments such as flourescence correlation spectroscopy (FCS).

The PDB structure of the complex informs the final state of our model and constrains the maximum copy number for each protein, while the protein copy number data gives time-dependent information about the protein copy number in the assembling complex.
Next, we represent, score and search for heterogeneity models models. These operations are performed by the heterogeneity_modeling.py in the Heterogeneity/Heterogeneity_Modeling folder. A single heterogeneity model is a set of protein copy numbers, scored according to its fit to experimental copy number data at that time point.
As ET and SAXS data, are only available at 0 minutes, 1 minute, and 2 minutes, we choose to create heterogeneity models at these three time points. We then use prepare_protein_library, documented here, to calculate the protein copy numbers for each heterogeneity model and to use the topology file of the full complex (spatiotemporal_topology.txt) to generate a topology file for each of the corresponding snapshot models. The choices made in this topology file are important for the representation, scoring function, and search process for snapshot models, and are discussed later. For heterogeneity modeling, we choose to model 3 protein copy numbers at each time point, and restrict the final time point to have the same protein copy numbers as the PDB structure.
From the output of prepare_protein_library, we see that there are 3 heterogeneity models at each time point (it is possible to have more heterogeneity models than copy numbers if multiple copies of the protein exist in the complex). For each heterogeneity model, we see 2 files:
Now, we have a variety of heterogeneity models. In general, there are four ways to assess a model: estimate the sampling precision, compare the model to data used to construct it, validate the model against data not used to construct it, and quantify the precision of the model. Here, we will focus specifically on comparing the model to experimental data, as other assessments will be performed later, when the trajectory model is assessed.

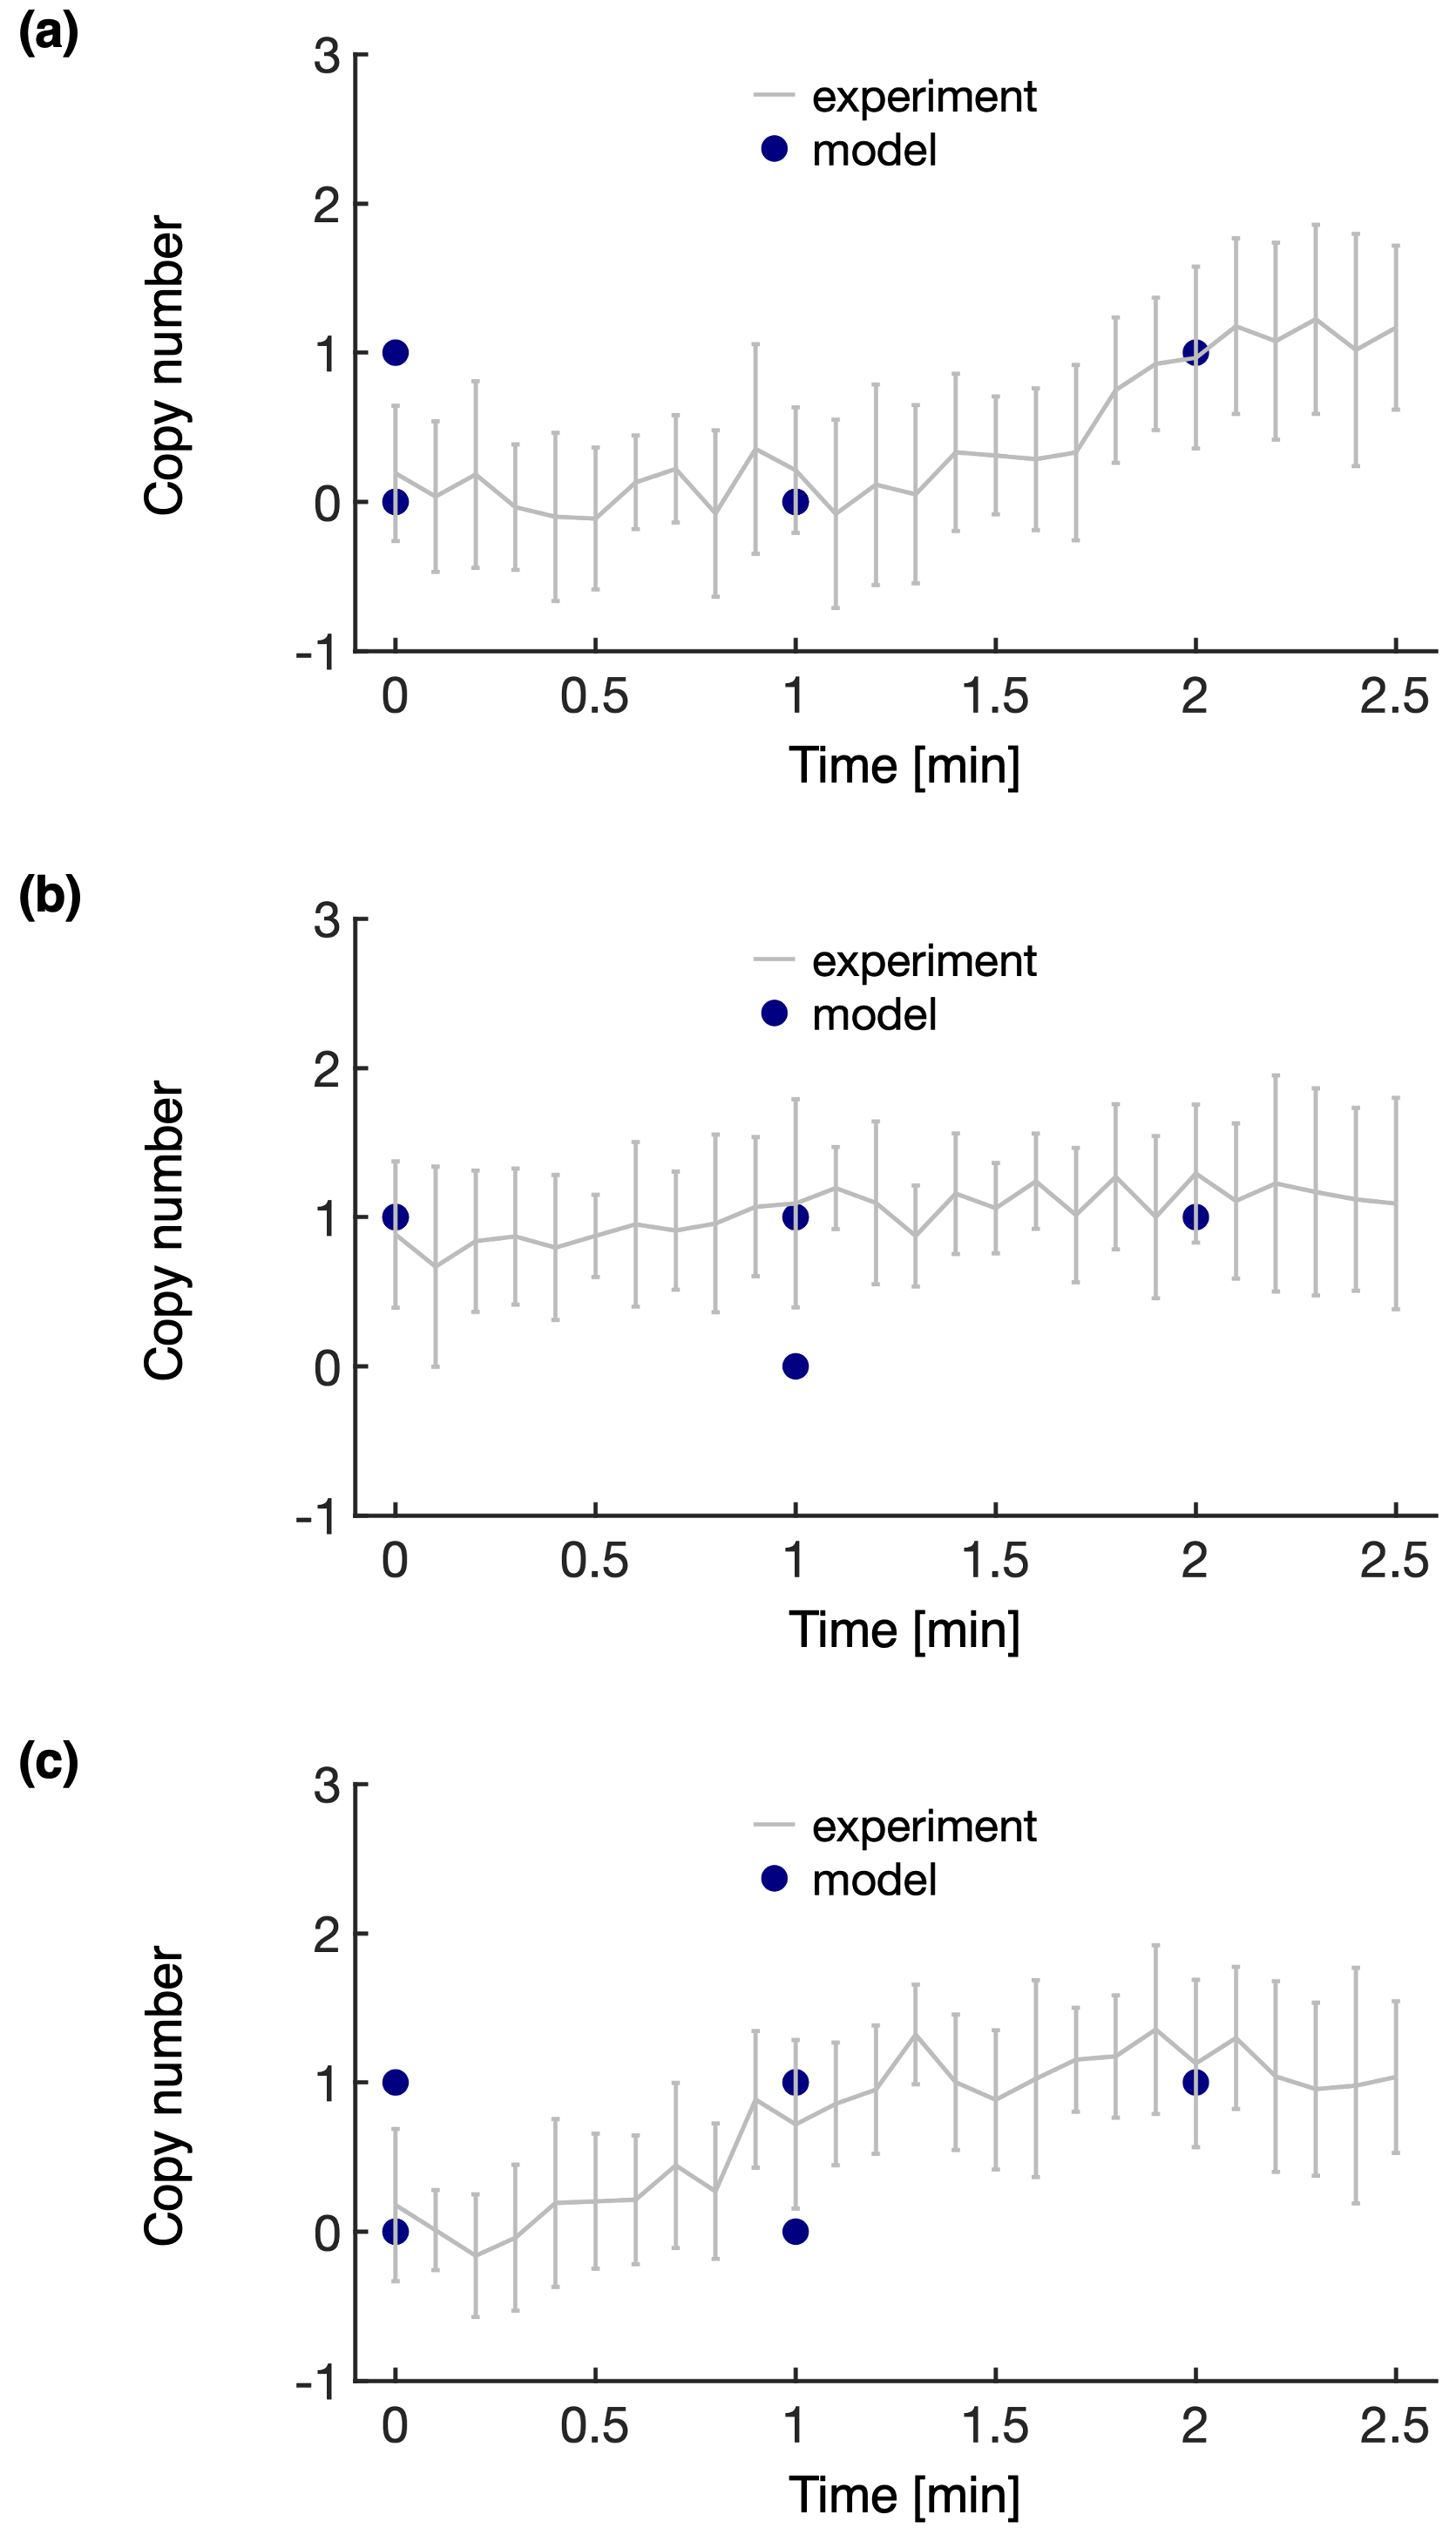
In the Heterogeneity/Heterogeneity_Assessment folder, there is a single script, plot_heterogeneity.py. This script plots the modeled and experimental copy numbers simultaneously, as shown below for proteins A (a), B (b), and C (c). From these plots, we observe that the range of possible experimental copy numbers are well sampled by the heterogeneity models, indicating that we are prepared for snapshot modeling.