 |
|
PMI RNAPII Modeling Tutorial
|
In this stage we perform post-clustering analysis. Here, we will perform calculations for:
The precision_rmsf.py script can be used to determine the within- and between-cluster RMSD (i.e., precision). To run, use:
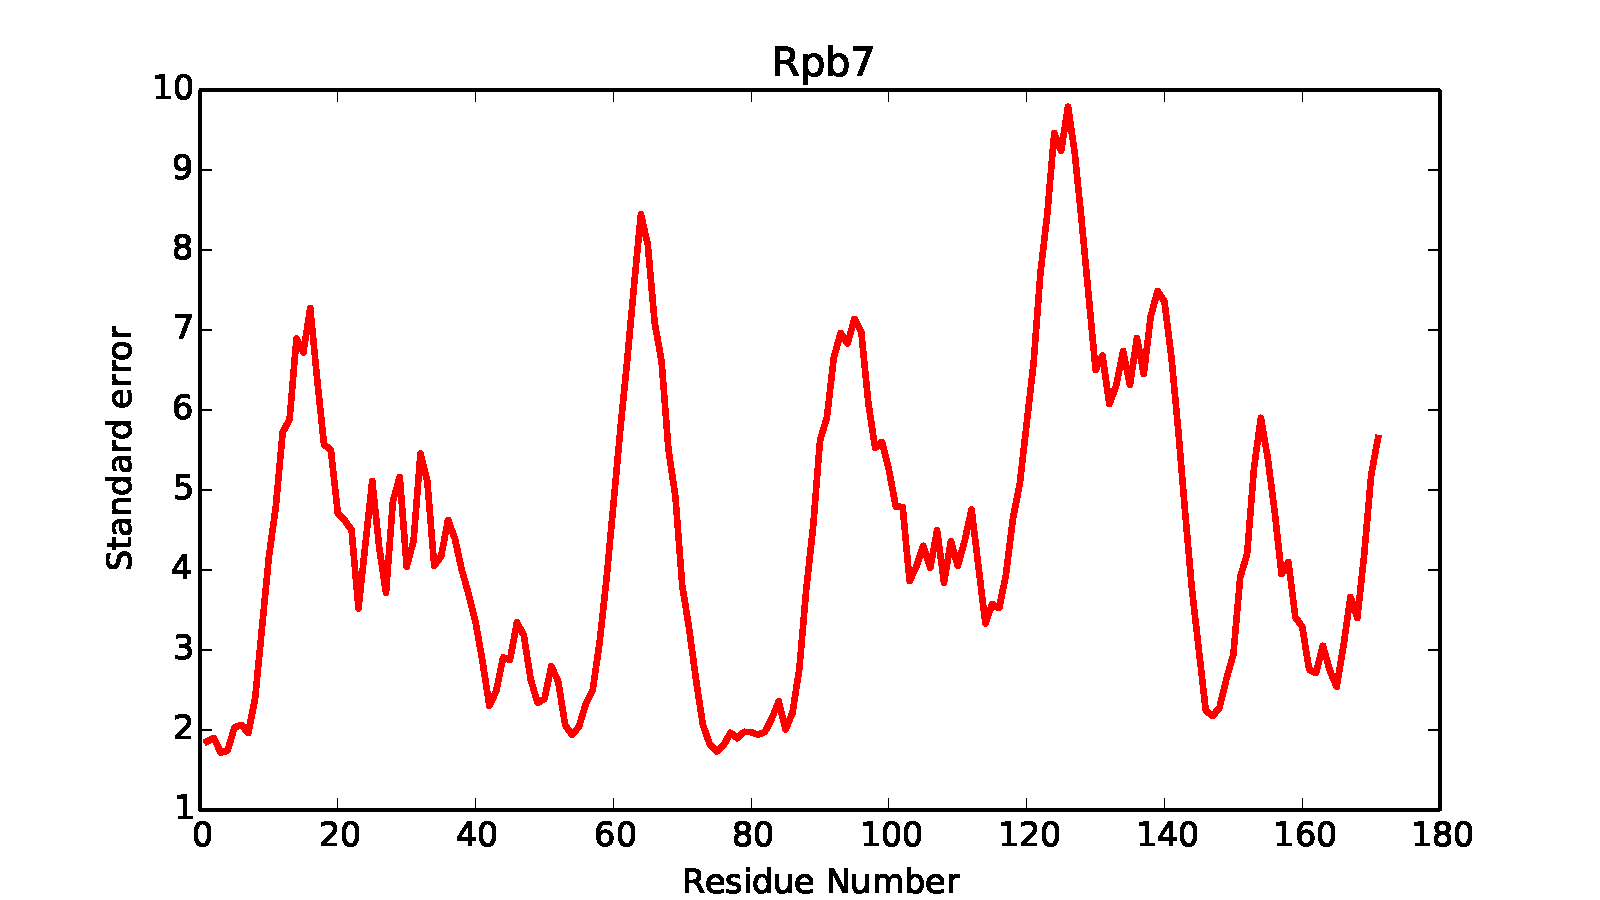
It will generate precision.*.*.out files in the kmeans* subdirectory containing precision information in text format, while in each cluster directory it generates .pdf files showing the within-cluster residue mean square fluctuation. In a similar way to earlier scripts, subsets of the structure can be selected for the calculation - in this case, we select the Rpb4 and Rpb7 subunits.
The script then sets up a model and Precision object for the given selections at the desired resolution for computation of the precision (resolution=1 specifies at the residue level).
Next, lists of structures are created that will be passed to the Precision object. rmf_list references the specific .rmf file, which with those frame_list is used to reference a particular frame in that .rmf to use (in this case, the only frame in the rmf, 0).
The list of frames and rmfs are added to the precision object
Self-precision and inter-cluster precision is then calculated, using the rmf_list and the output is placed in root_cluster_directory.
Finally, the RMSFs for each residue in the analyzed components are calculated and stored in root_cluster_directory/rmsf.COMPONENT_NAME.dat

We have provided a script to evaluate the accuracy of a model against a native configuration. When run, it will enumerate the structures in the first cluster and print the average and minimum distance between those structures and a given reference model. This is useful for benchmarking (but obviously is of no use when we don't know the 'real' structure).
To run, use
First, identify the reference structure and list of .rmf structures to use in calculation
The components that will be compared to reference must be explicitly enumerated in selections
Initialize an IMP Model and Precision class object and add the selections. Then add the list of .rmf structures
Average to the reference structure in angstroms for each component in selections is then calculated and outputted to the screen.
The output of this analysis will be printed in the terminal. For instance, you will get something like:
Rpb4 average distance 20.7402052384 minimum distance 11.9324734377
All average distance 5.05387877292 minimum distance 3.4664144466
Rpb7 average distance 10.5032807663 minimum distance 5.06599370365
Rpb4_Rpb7 average distance 16.0757238511 minimum distance 9.63785403195
The average distance is the average RMSD of each model in the cluster with respect to the reference structure. The program prints values for all selections (Rpb4, Rpb7 and Rpb4_Rpb7) and automatically for all the complex (All)
We can also determine sampling exhaustiveness by dividing the models into multiple sets, performing clustering on each set separately, and comparing the clusters. This step is left as an exercise to the reader. To aid with splitting the data, we have added the optional keyword first_and_last_frames to the IMP::pmi::macros::AnalysisReplicaExchange0::clustering() method. If you set this keyword to a tuple (values are percentages, e.g. [0,0.5]), it will only analyze that fraction of the data. Some things you can try:
precision_rmsf.py, which will automatically compute cross-precision for the clusters.If the sampling is exhaustive, then similar clusters should be obtained from each independent set, and the inter-cluster precision between two equivalent clusters should be very low (that is, there should be a 1:1 correspondence between the two sets of clusters, though the ordering may be different).
Once the sampling and analysis is complete, it may be clear from the results that more experimental data is needed (or perhaps adjustments to the modeling protocol need to be made). In this case another cycle of the integrative modeling procedure may be necessary.
Alternatively, the study may be complete and ready for publication. Typically this would be accompanied by the deposition of the modeling study in the PDB-IHM database in mmCIF format; see the deposition tutorial for more information.