 |
|
PMI RNAPII Modeling Tutorial
|
In this stage, we find all available experimental data that we wish to utilize in structural modeling. In theory, any method that provides information about absolute or relative structural information can be used.
The rnapolii/data folder in the tutorial input files contains the data included in this example:
.mrc, .txt files)FASTA File
Each residue included in modeling must be explicitly defined in the FASTA text file. Each individual component (i.e., a protein chain) is identified by a string in the FASTA header line. From 1WCM.fasta:
>1WCM:A|P04050
MVGQQYSSAPLRTVKEVQFGLFSPEEVRAISVAKIRFPETMDETQTRAKIGGLNDPRLGSIDRNLKCQTCQEGMNECPGH
FGHIDLAKPVFHVGFIAKIKKVCECVCMHCGKLLLDEHNELMRQALAIKDSKKRFAAIWTLCKTKMVCETDVPSEDDPTQ
...

>1WCM:B|P08518
MSDLANSEKYYDEDPYGFEDESAPITAEDSWAVISAFFREKGLVSQQLDSFNQFVDYTLQDIICEDSTLILEQLAQHTTE
SDNISRKYEISFGKIYVTKPMVNESDGVTHALYPQEARLRNLTYSSGLFVDVKKRTYEAIDVPGRELKYELIAEESEDDS
...
defines two chains with unique IDs of 1WCM:A and 1WCM:B respectively. The remainder of the FASTA header (after the | character) can be used to state the UniProt accession of the sequence, if the sequence is in UniProt. (This is not absolutely required, and the accession is not used directly in the modeling, but it does simplify deposition of any final models.)
The entire complex is 12 chains and 4582 residues.
Electron Density Map
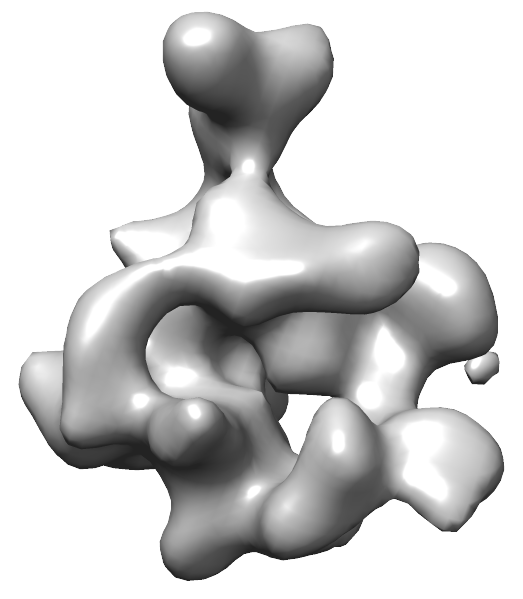
The electron density map of the entire RNA Poly II complex is at 20.9 Angstrom resolution. The raw data file for this is stored in emd_1883.map.mrc.

Electron Density as Gaussian Mixture Models
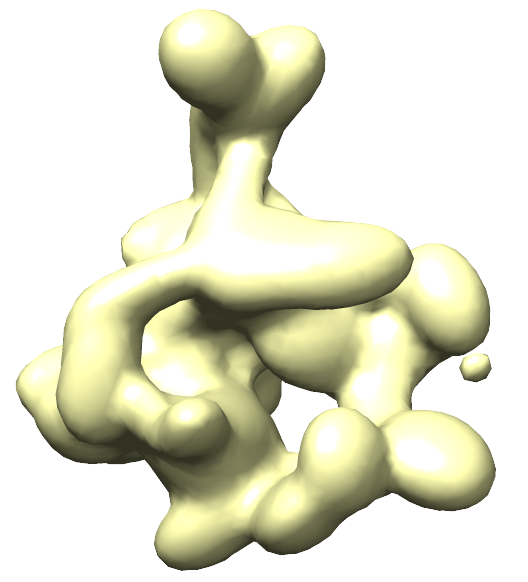
Gaussian mixture models (GMMs) are used to greatly speed up scoring by approximating the electron density of individual subunits and experimental EM maps. A GMM has been created for the experimental density map, and is stored in emd_1883.map.mrc.gmm.50.mrc. The weight, center, and covariance matrix of each Gaussian used to approximate the original EM density can be seen in the corresponding .txt file.

PDB File
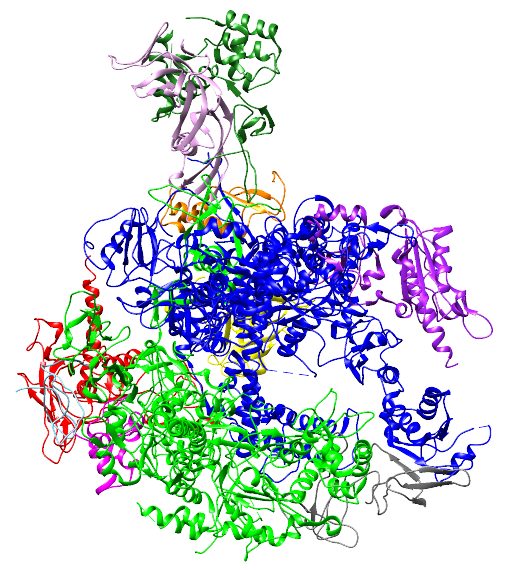
High resolution coordinates for all 12 chains of RNA Pol II are found in 1WCM.pdb.

Chemical Cross-Links
All chemical cross-linking data is located in polii_xlinks.csv and polii_juri.csv. These files contain multiple comma-separated columns; four of these specify the protein and residue number for each of the two linker residues.
prot1,res1,prot2,res2
Rpb1,34,Rpb1,49
Rpb1,101,Rpb1,143
Rpb1,101,Rpb1,176
The length of the DSS/BS3 cross-linker reagent, 21 angstroms, will be specified later in the modeling script.
With data gathered, we can now proceed to Stage 2 - Representation of subunits and translation of the data into spatial restraints.