 |
|
IMP Tutorial
|
In this tutorial we will look at CPU profiling of IMP code using Google's gperftools package. This will show us where time is being spent during a modeling run, so that we know where to focus our efforts in optimizing or otherwise improving the code.
In this text we follow Google's own documentation.
First, we need to install gperftools. It can be compiled from source code, but it is generally easier to install a prebuilt package for it. We recommend running it on a Linux box, although it should also work on a Mac. To install on a Linux box, use something like
sudo dnf install pprof gperftools-libs
On a Mac with Homebrew, use
brew install gperftools
Next, we need to build IMP from source code. See the installation instructions in the manual for more details. In order to use gperftools the IMP libraries should be linked against the profiler library (-lprofiler). This should be set up automatically when you run cmake. If not, you can manually add this linkage by adding something like -DCMAKE_LD_FLAGS="-lprofiler" to your cmake invocation.
There are several ways to collect profiling information; see the gperftools documentation for more details. In this case, we simply collect profiling information for the entire process by setting the CPUPROFILE environment variable to the name of a profile output file. For this demonstration, we'll profile the modeling script from the RNAPII PMI tutorial by running something like the following from a terminal window:
git clone https://github.com/salilab/imp_tutorial.git
cd imp_tutorial/rnapolii/modeling
env CPUPROFILE=out.prof ~/imp/release/setup_environment.sh python modeling.py --test
(This assumes that our IMP source code checkout is in ~/imp/release/; alter the path appropriately if it is in a different directory.)
Once the script completes, a file out.prof should be produced.
Analysis of the profile can be done using the pprof tool. There are many ways to use this tool; see the gperftools documentation for more details. A simple way to use it is to generate a PDF file and then view it in a PDF viewer:
pprof --pdf /usr/bin/python out.prof > complete.pdf
The resulting PDF can be seen here. This view can be rather overwhelming, since it shows every function (in IMP itself, but also in the Python interpreter and in the system libraries) that was responsible for a significant chunk of the program's runtime. Each node in the graph shows the name of the function, the percentage of total runtime that was spent in the body of this function itself, and the percentage of time that was spent both in the function and in other functions that it called. Edges in the graph point from calling functions to other functions that were called.
In most cases it makes more sense to focus in on a subset of the program. For a typical application of IMP, a fixed setup is followed by a long sampling run where the majority of the CPU time is spent (in the function IMP::Optimizer::optimize). Inspection of the complete profile confirms that this is the case here too. We can make such a focused graph using the --focus option to pprof:
pprof --pdf --focus optimize /usr/bin/python out.prof > optimize.pdf
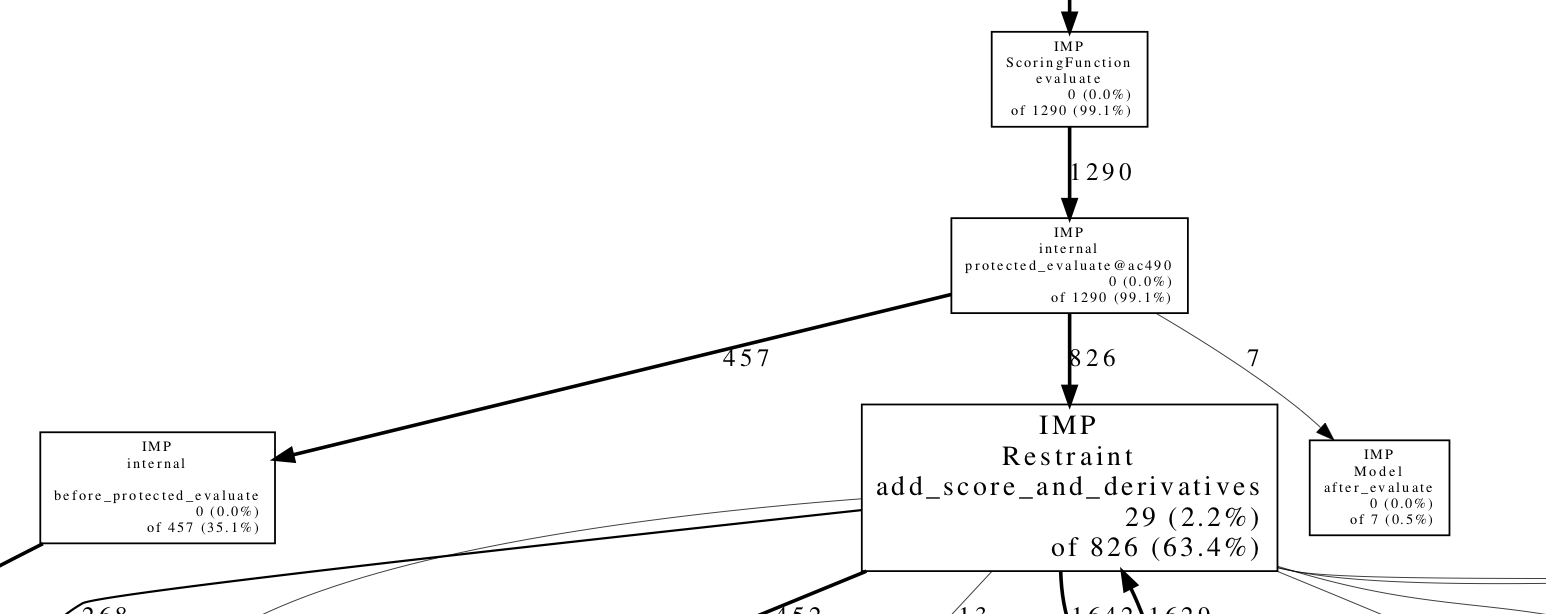
The resulting PDF can be seen here. Let's zoom in on part of the graph:

This shows us that evaluation of the scoring function (IMP::ScoringFunction::evaluate) is responsible for 99.1% of the runtime of the sampling. This confirms our expectation that applying Monte Carlo moves and applying the Monte Carlo acceptance criterion are fairly inexpensive operations. Of that time, roughly one third is spent in before_protected_evaluate, which does various per-scoring operations, such as updating the non-bonded list and ensuring constraints such as rigid bodies are satisfied, while the other two thirds is spent calculating restraint scores.
Further inspection of the graph can reveal where significant time is being spent. This may be because the function is being called more times than is necessary, or because the function is inefficient and can be made faster. For example, in this case 20% of the entire runtime is spent in IMP::core::RigidBody::update_members, which sets the XYZ coordinates of each particle in a rigid body using the rigid body's orientation and the internal coordinates (relative to the body's reference frame). This is probably inefficient because this update is only necessary after a Monte Carlo move that affects a given rigid body, and the majority of moves do not.