 |
|
IMP Manual
for IMP version 2.8.0
|
Nup133 is one of the proteins that make up the yeast Nuclear Pore Complex (NPC). The structure of this protein has been characterized by both X-ray crystallography and small angle X-ray (SAXS). SAXS differs from X-ray crystallography in that it is applied to proteins in solution rather than crystals; thus, it can be applied to a much wider range of proteins in states more closely resembling their functional forms than X-ray crystallography. Because the sample is in solution, the SAXS information is rotationally averaged and so the resulting SAXS profile gives less structural information than X-ray crystallography; however, this is often sufficient to determine problems with the structure or to distinguish possible conformations.
IMP includes a command line tool foxs for handling SAXS profiles, which will be demonstrated in this example. There is also a web interface available, which functions similarly.
For full help on the foxs tool, run from a command line:
First, obtain the input files used in this example and put them in the current directory, by typing:
(On a Windows machine, use copy rather than cp.) Here, <imp_example_path> is the directory containing the IMP example files. The full path to the files can be determined by running in a Python interpreter 'import IMP.foxs; print(IMP.foxs.get_example_path('nup133'))'.
The structure of the C-terminal domain of yeast Nup133 is available in the RCSB Protein Data Bank (PDB) as code 3kfo (file 3KFO.pdb), while the experimental SAXS profile is given in the 23922_merge.dat file. The atomic structure can be fit against the SAXS profile by running FoXS:
FoXS calculates the theoretical profile of the 3KFO structure and fits it against the experimental profile, and determines the quality of the fit, Chi, with smaller values corresponding to closer fits. It also generates two .dat files, one containing the theoretical profile and the other this profile fit against the experimental profile. These files can be input to a plotting package (two gnuplot input files with a .plt extension are provided).
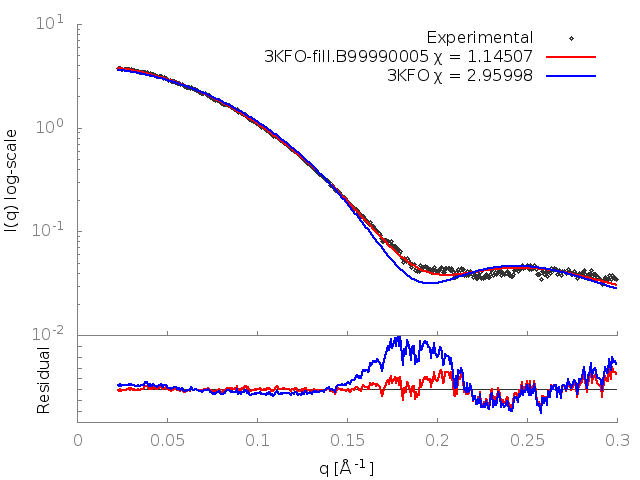
The fit in this example is not a good one (Chi=2.96). To understand why this is so, the header of the 3KFO PDB file can be examined in a text editor. This reveals two problems. Several residues at the N and C termini were not resolved in the X-ray experiment (9 in total, 2 at the N terminus and 7 at the C terminus), and the sidechains of 16 other residues could also not be located (REMARK 465 and REMARK 470 lines). This problem can be resolved by adding in the missing atoms and residues by using MODELLER, which generated the 3KFO-fill.B99990005.pdb file.
The fits of the original PDB and the new structure can now be generated by running:
The output shows that the new structure has a significantly better fit (Chi=1.15). FoXS generates a gnuplot input file fit.plt which will plot the fits of all of the PDBs given against the profile. This can be run with:
This generates an image, fit.png, showing the theoretical profiles (lines in top panel), the experimental profile (points in top panel) and the ratios of the experimental to theoretical profiles (bottom panel):
