|
|
IMP Manual
for IMP version 2.6.0
|
In this example, cnmultifit is employed to generate a model of part of the bacterial molecular chaperone GroEL. GroEL is composed of two heptameric rings of identical 57 kDa subunits stacked back to back; here one of the rings is modeled. cnmultifit takes as input a structure of a single subunit of the ring, and a cryo-electron microscopy (cryo-EM) map of the entire assembly.
(For the purposes of this example, it is assumed that the single subunit structure is already available. In the more general case, this can be generated using a tool such as MODELLER. See the GroEL biological system for a fully worked example.)
All steps in the procedure use a command line tool called cnmultifit. (There is also a web interface available.) For full help on this tool, run from a command line:
First, obtain the input files used in this example and put them in the current directory, by typing:
(On a Windows machine, use copy rather than cp.) Here, <imp_example_path> is the directory containing the IMP example files. The full path to the files can be determined by running in a Python interpreter 'import IMP.cnmultifit; print(IMP.cnmultifit.get_example_path('groel'))'.
The first step is to generate a map of the surface of the subunit, 1oel_A.pdb. This surface is used by later steps of the modeling to place copies of the subunit together without interpenetrating:
This generates a surface file, 1oel_A.pdb.ms.
Next, create a parameters file to control the operation of cnmultifit:
This generates a parameter file multifit.param in .ini format. It contains the parameters given on the command line, and a number of other parameters that control the model generation procedure. These can be tweaked if necessary.
The -n option controls the number of models that will be built (5 in this case); if it is not given, 10 models will be built by default. Next, the symmetry of the map is given; GroEL has C7 symmetry so '7' is given here. This is followed by the name of the subunit PDB file and the cryo-EM map MRC file. Next, the resolution of the map in angstroms (10) is given, and its spacing in angstroms (1.5) and density threshold (20). Finally, the origin of the map in angstroms is given (-130.5, -84, -87).
The spacing (or pixel size) and the origin of the map are often stored in the map header. This can be viewed by running:
The resolution is typically not stored in the map header; it is usually provided in the corresponding publication and can also be found in the corresponding EMDB entry. A threshold is often provided by the author in the EMDB entry as "Recommended counter level" under the "Map Information" section.
Now that all input files are prepared, the modeling procedure itself can be run with:
This generates models as PDB files named asmb.model.*.pdb, ranked by score (model 0 should be the best fit to the density). It also generates a file multifit.output that shows the transformation needed to place the subunit in the density.
The optional –chimera parameter requests the same transformation output in a Chimera-compatible format. To generate PDB files from the Chimera output file, use:
This generates models named test.*.pdb.
If a single 'reference' PDB file is available of the entire complex, the cnmultifit output can be compared against this reference with:
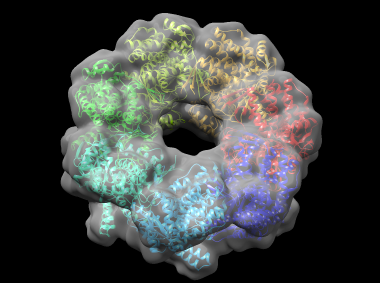
This generates a file rmsd.output which shows, for each model, the root-mean-square deviation (RMSD) in angstroms between the model and the reference structure, and the cross-correlation between the model's theoretical density and the cryo-EM map. Model 0 has an RMSD of around 2.5 angstroms, which is very close to the native structure. A Chimera view of the protein, fitted into the density map, is shown below: